Extreme Networks WiNG Access Points offer several remote packet capture options that are very useful for troubleshooting. For example, the remote-debug command can capture the wireless traffic of an associated device across several distributed remote access points in one command.
Here are some integrated packet capture tools available in the CLI of a Controller or an Access Point with WiNG version 5.x:
service pktcap
remote-debug live-pktcap
remote-debug offline-pktcap
sniffer-redirect
Local packet capture
The service pktcap command captures the local traffic traversing a physical or logical interface of an access point. The command is applied in the console of the Access Point.
At first, a capture point on the access point must be chosen:
AP7532#service pktcap on ?
bridge Capture packets transiting through the ethernet bridge
deny Capture packets being denied by an ACL
dpi Capture packtes forwarded to dpi engine (dpi engine must be
enabled to capture packtes on this location)
drop Capture packets being dropped
ext-vlan Capture packets forwarded to/from an extended-vlan
interface Capture packets received/send through an interface
radio Capture packets on a radio (802.11)
rim Capture packets at radio interface module
router Capture packets transiting through the IP router
vpn Capture packets forwarded to/from a VPN link
wireless Capture packets forwarded to/from wireless
You can use the radio or interface radio option to capture any wireless packets along with some information from their 802.11 header. It includes any wireless frames that are destined to the radio and that are transmitted by the radio. Except for the 802.11 Beacon frames that are serviced by the access point; they do not appear on the capture, probably to reduce the size of the capture. In addition it does not include any traffic for another Access Point.
Importantly the radios are still servicing wireless clients while the packet capture is performed.
Note that the wireless option captures the traffic that is bridged to and from the wireless interfaces, after decapsulation of the 802.11 header. In this case, no wireless information appears in the packet capture.
To capture the wireless frames on both the 2.4GHz and 5GHz radio interfaces, and display the packet capture on the console output:
AP7532#service pktcap on radio all
Capturing up to 50 packets. Use Ctrl-C to abort.
1 0:13:02.413128 I BEACON Src:78-8A-20-BD-49-FA Dst:FF-FF-FF-FF-FF-FF Bss:78-8A-20-BD-49-FA, SSID "", CH 1, RSSI -42, RATE 1, bw 20MHz, sgi=0
2 0:13:02.433367 I PROBE_REQ Src:38-8B-59-3F-3F-F1 Dst:FF-FF-FF-FF-FF-FF Bss:FF-FF-FF-FF-FF-FF, SSID "Laptop 5.0", CH 36, RSSI -62, RATE 1, bw 20MHz, sgi=0
3 0:13:02.436176 I PROBE_REQ Src:38-8B-59-3F-3F-F1 Dst:FF-FF-FF-FF-FF-FF Bss:FF-FF-FF-FF-FF-FF, SSID "Laptop 5.0", CH 36, RSSI -62, RATE 1, bw 20MHz, sgi=0
4 0:13:02.437273 I PROBE_REQ Src:38-8B-59-3F-3F-F1 Dst:FF-FF-FF-FF-FF-FF Bss:FF-FF-FF-FF-FF-FF, SSID "Laptop 5.0", CH 36, RSSI -90, RATE 1, bw 20MHz, sgi=0
5 0:13:02.439388 I BEACON Src:12-DA-43-BC-E6-82 Dst:FF-FF-FF-FF-FF-FF Bss:12-DA-43-BC-E6-82, SSID "Phone WiFi", CH 1, RSSI -90, RATE 1, bw 20MHz, sgi=0
6 0:13:02.440489 I PROBE_REQ Src:38-8B-59-3F-3F-F1 Dst:FF-FF-FF-FF-FF-FF Bss:FF-FF-FF-FF-FF-FF, SSID "Laptop 5.0", CH 36, RSSI -62, RATE 1, bw 20MHz, sgi=0
7 0:13:02.449908 I BEACON Src:72-10-3E-98-BD-34 Dst:FF-FF-FF-FF-FF-FF Bss:72-10-3E-98-BD-34, SSID "zen-guest", CH 1, RSSI -73, RATE 1, bw 20MHz, sgi=0
8 0:13:02.452770 I BEACON Src:94-10-3E-98-BD-37 Dst:FF-FF-FF-FF-FF-FF Bss:94-10-3E-98-BD-37, SSID "zen ", CH 1, RSSI -73, RATE 1, bw 20MHz, sgi=0
9 0:13:02.464237 I BEACON Src:7A-8A-20-BD-49-FA Dst:FF-FF-FF-FF-FF-FF Bss:7A-8A-20-BD-49-FA, SSID "", CH 1, RSSI -42, RATE 1, bw 20MHz, sgi=0
10 0:13:02.471936 I BEACON Src:12-13-31-9B-54-33 Dst:FF-FF-FF-FF-FF-FF Bss:12-13-31-9B-54-33, SSID "Totoro", CH 1, RSSI -82, RATE 1, bw 20MHz, sgi=0
…
23 0:13:02.584208 I PROBE_REQ Src:EC-9B-F3-32-F1-40 Dst:FF-FF-FF-FF-FF-FF Bss:FF-FF-FF-FF-FF-FF (any SSID), CH 1, RSSI -49, RATE 1, bw 20MHz, sgi=0
24 0:13:02.591405 O PROBE_RESP Src:74-67-F7-F0-18-B0 Dst:EC-9B-F3-32-F1-40 Bss:74-67-F7-F0-18-B0, SSID "TestSSID", CH 1, RATE 1, SUCCESS: Y
Frame are displayed with some radio information (Channel, RSSI and Data Rate) and some information from the 802.11 header (802.11 Frame Type/Subtype, Source Address, Destination Address, BSSID Address, SSID).
In this example, Beacons from other service sets and Probe Requests have been captured because the destination is broadcast (FF-FF-FF-FF-FF-FF). No Beacon frames broadcasted by the Access Point (with the SSID “TestSSID”) were displayed, but one Probe Response frame advertising this SSID from the Access Point is seen in the last line.
The verbose option provides more details from the 802.11 header:
ap7532#service pktcap on radio all verbose
Capturing up to 50 packets. Use Ctrl-C to abort.
----------------------------------------------------------------------
Packet 1:
Time: 3:28:12.201110, Len: 226, Dir: inbound, 802.11, Priority: 0, Wlan: 0, l3_off: 24, l4_off: 0
802.11: BEACON Src:78-8A-20-BD-49-FA Dst:FF-FF-FF-FF-FF-FF Bss:78-8A-20-BD-49-FA, SSID "", CH 1, RSSI -42, RATE 1, bw 20MHz, sgi=0
Type:mgmt, SubType:BEACON, Duration:0, Seq:2524, Frag:0, MoreFrags:0
FromDS:0, ToDS:0, Retry:0, PowerMgmt:0, MoreData:0, Protected:0
----------------------------------------------------------------------
Packet 2:
Time: 3:28:12.204259, Len: 240, Dir: inbound, 802.11, Priority: 0, Wlan: 0, l3_off: 24, l4_off: 0
802.11: BEACON Src:12-DA-43-BC-E6-82 Dst:FF-FF-FF-FF-FF-FF Bss:12-DA-43-BC-E6-82, SSID "Phone WiFi", CH 1, RSSI -89, RATE 1, bw 20MHz, sgi=0
Type:mgmt, SubType:BEACON, Duration:0, Seq:1899, Frag:0, MoreFrags:0
FromDS:0, ToDS:0, Retry:0, PowerMgmt:0, MoreData:0, Protected:0
…
----------------------------------------------------------------------
Packet 90:
Time: 3:28:27.047719, Len: 386, Dir: inbound, 802.11, Proto: 0x0800, Vlan: 1, Priority: 0, Wlan: 0, l3_off: 42, l4_off: 62
802.11: QOS-DATA Src:EC-9B-F3-32-F1-40 Dst:FF-FF-FF-FF-FF-FF Bss:74-67-F7-F2-50-30 (to DS), CH 36, RSSI -39, RATE mcs8-s2, bw 20MHz, sgi=0
Type:data, SubType:QOS-DATA, Duration:48, Seq:3, Frag:0, MoreFrags:0
FromDS:0, ToDS:1, Retry:0, PowerMgmt:0, MoreData:0, Protected:1, Tid:0
IPv4: 0.0.0.0 > 255.255.255.255, proto UDP, IPv4 length 336, DSCP 0, Id 35392
UDP: ports 68 > 67, data length 316
DHCP: Discover from EC-9B-F3-32-F1-40
The associated traffic appears unencrypted in the console output and some upper layer information is provided. In the previous example, there is a DHCP Discover packet from a wireless client.
By default, the command captures 50 packets. You can add the count option to increase the packet count, up to 1,000,000 packets. To stop the capture before it finishes, press Crtl-C
ap7532#service pktcap on radio all count ?
<1-1000000> Packet count
Secondly, the destination of the capture can be changed with the write option. Presentation options can be either:
displayed onto the console output (by default, without the write option)
saved locally on the access point (flash memory)
sent to a FTP or TFTP host
sent in real-time to a remote packet sniffer (Wireshark) using TaZman Sniffer Protocol (TZSP)
To capture all the wireless packets and copy the resulted .pcap file to a TFTP server:
ap7532#service pktcap on radio all count <NB> write tftp://<HOSTNAME|IP>/<PATH>/<FILENAME>
Capturing up to <NB> packets. Use Ctrl-C to abort.
Once completed, open the following pcap file with Wireshark. In the following example, a wireless client association to the Access Point has been captured. We can filter the packets related to the client with the following Wireshark display filter: wlan.addr == ec:9b:f3:32:f1:40

The next picture shows the Association Request from the client to the Access Point.

The capture shows that all frames are encapsulated using a pseudo header called “IEEE 802.11 plus Radiotap radio header”.
The IEEE 802.11 header provides the Media Access Control layer information transmitted over the air. The Radiotap Header adds some additional information about the frame such as:
Antenna Signal: RF signal power at the antenna, in dBm
Data Rate: Transmit or received data rate, in unit of 500 Kbps
Channel Frequency: frequency in MHz, following by flags indicating the modulation type
Those values can also be displayed in Wireshark columns: radiotap.dbm_antsignal, radiotap.datarate, radiotap.channel.freq
Or using their equivalent values under another pseudo header: wlan_radio.signal_dbm, wlan_radio.data_rate, wlan_radio.frequency
Finally the frames can appear encrypted with Wireshark, compared to using the console output on the Access Point.
To decrypt the 802.11 Data frames in the pcap file from an Extreme Access Point, edit the IEEE 802.11 settings in Wireshark:
In the Edit menu, select Preferences | Protocols | IEEE 802.11, and set "Ignore the Protection bit” to "Yes - with IV".

Check Enable decryption and click on the Edit button for the Decryption keys.
Click on the + button to add a decryption key. For WPA2-PSK authentication, set the Key Type to wpa-pwd and set the Key with the following format: passphrase:SSID

Click on OK. The packets should be decrypted if their associated 4-way handshake was captured.
The command can also send the packet capture in a real-time continuous stream to a protocol analyser using TZSP as explained in the next section.
Remote packet capture
The remote-debug command performs a distributed packet capture from remote Access Points using the live-pktcap option. This command is executed on the RF Domain manager, which is more scalable than the service pktcap command.
At first, the scope of the packet captures must defined within a set or every Access Point of an RF domain:
ap7532#remote-debug live-pktcap ?
hosts Remote hosts
rf-domain Specify the RF-Domain
Then the presentation (write option), the capture points and the filters are configured similarly to the service pktcap command.
To reduce the size of the destination file or the required bandwidth, you can use the filter option with one or a set of match condition filters. The Access Point provides many different types of filter (by protocol, by addresses or by minimum RSSI for example) to refine the capture.
ap7532#remote-debug live-pktcap rf-domain default radio all filter ?
LINE User-defined packet capture filter (enclose in " if ( and ) are
used)
arp Match ARP packets
capwap Match CAPWAP packets
cdp Match CDP packets
dot11 Match 802.11 packets
dropreason Match packet drop reason
dst Match IP destination
ether Ethernet
failed Match failed 802.11 transmitted frames
gre Match GRE packets
gre6 Match GREv6 packets
host Match IP address (IP or ARP)
icmp Match ICMP packets
icmp6 Match ICMPv6 packets
igmp Match IGMP packets
ip Match IPv4 packets
ip6 Match IPv6 packets
l2 Match L2 header
l3 Match L3 header
l4 Match L4 header
lldp Match LLDP packets
mint Match MINT packets
net Match IP in subnet
not Logical not
port Match TCP or UDP port
priority Match packet priority
radio Match radio
rssi Match ingress RSSI
src Match IP source
stp Match STP packets
tcp Match TCP packets
tcp6 Match TCP over IPv6 packets
udp Match UDP packets
udp6 Match UDP over IPv6 packets
vlan Match vlan
wlan Match wlan
For example, the dot11 filter can specify 802.11 addresses or 802.11 frame types as match conditions. The filters can be fine-tuned with some logical conditions (and, or, not).
AP7522#remote-debug live-pktcap rf-domain default radio all filter dot11 ?
addr Match 802.11 address
and Logical and
beacon Match 802.11 beacon frames
bss Match BSS ID
ctrl Match 802.11 control frames
data Match 802.11 data frames
mgmt Match 802.11 management frames
or Logical or
probe Match 802.11 probe frames
stype Match 802.11 subtype
A typical use of remote-debug is to capture all the traffic of a wireless client within a RF domain, and to export the .pcap file to a TFTP server. This command is useful for troubleshooting roaming scenarios:
ap7532#remote-debug live-pktcap rf-domain default write tftp://<HOSTNAME|IP>/<PATH>/<FILENAME> radio all count <NB> filter dot11 addr 1 EC-9B-F3-32-F1-40 or dot11 addr 2 EC-9B-F3-32-F1-40 or dot11 addr 3 EC-9B-F3-32-F1-40
In this example, the RF domain manager aggregates the packets related to the wireless client (MAC: EC-9B-F3-32-F1-40) and copies the resulted capture file to the TFTP host.
You can check the status of remote-debug sessions:
ap7532#show remote-debug
Currently running sessions
live-pktcap-1: Type:live-pktcap, Started by:admin
Completed sessions
live-pktcap-0: Type:live-pktcap, Started by:admin
ap7522: Successfully received 354720 bytes
ap7532: Successfully received 230661 bytes
The Access Point allows one running session at a time.
The following example shows a wireless client roaming from an Access Point on channel 36 to another Access Point on channel 6.
Each frame is also encapsulated with a Radiotap header and the 802.11 header.
The following picture shows a DHCP Request from the client.

In this case, the Data Rate displayed in the Radiotap pseudo-header is 11n HT MCS15 (130 Mbps).
Another way to reduce the bandwidth required is the snap option, which truncates the length of each packet.
Finally, there is a last presentation method using TaZman Sniffer Protocol (TZSP) protocol, which sends the packets to a protocol analyser such as Wireshark for real-time analysis. The live capture wraps the packets into TZSP headers. It uses the UDP protocol with the destination port 37008 to transport them to destination. TZSP is also available with the service pktcap command.
To ensure that Wireshark can receive the TZSP streams, the UDP port 37008 must be opened on the operating system. If the port is not opened, the host may reply with an ICMP Destination Port Unreachable. In Windows, you can use the Iperf software or Netcat to open the port and avoid the ICMP Destination Port Unreachable messages. Make sure that the port is also not filtered by a firewall.
Using Iperf in server mode:
iperf.exe -s -u -p 37008
------------------------------------------------------------
Server listening on UDP port 37008
Receiving 1470 byte datagrams
UDP buffer size: 64.0 KByte (default)
------------------------------------------------------------
Using Netcat in listener mode:
nc -l -p 37008 -u
To check that the port is opened, you can use the netstat command:
netstat –anob
Active Connections
Proto Local Address Foreign Address State PID
RpcSs
…
UDP 0.0.0.0:37008 *:* 872
[iperf.exe]
To perform a live capture of the packets of a wireless client using TZSP:
ap7532#remote-debug live-pktcap rf-domain default write tzsp <HOSTNAME | IP> radio all count <NB> filter dot11 addr 1 EC-9B-F3-32-F1-40 or dot11 addr 2 EC-9B-F3-32-F1-40 or dot11 addr 3 EC-9B-F3-32-F1-40
The default number of captured packets is 50, and the maximum number is 1,000,000 packets.
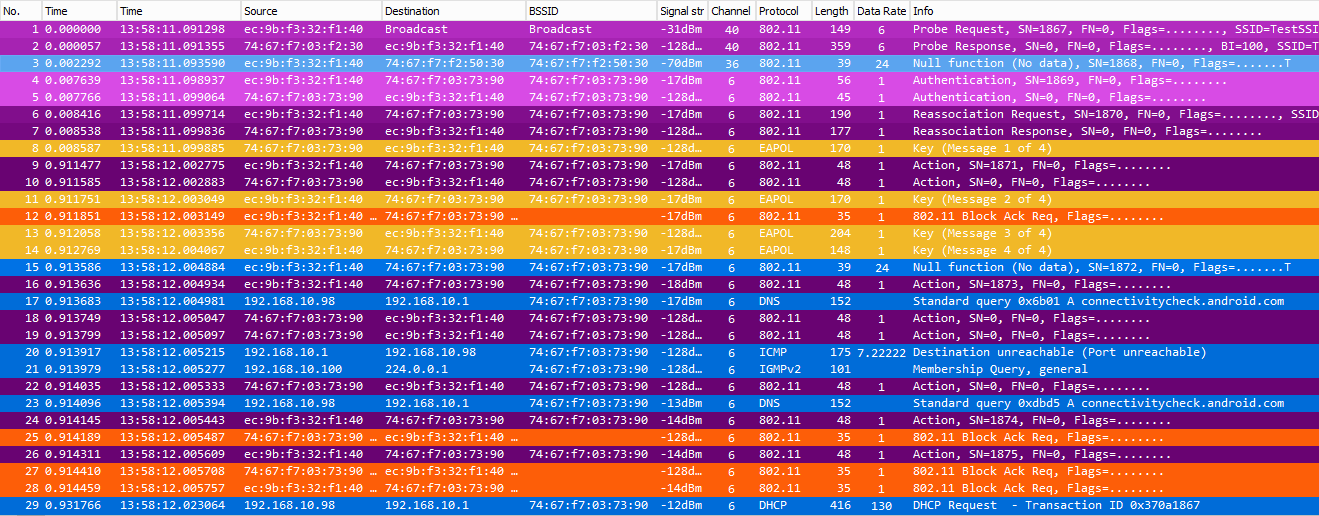
Open Wireshark and start capturing packet on the selected interface. The live capture can be highlighted using the display filter tzsp.

However when using TZSP, the packet capture does not display any HT/VHT 802.11n/ac Data Rates but only 802.11a/b/g Data Rates.
The following picture shows an 802.11 Reassociation Request with its TZSP header:

There are several well-known TZSP fields similar to the Radiotap fields:
Signal: Signal strength, in dBm
Rate: Data Rate, in unit of 500 Kbps
Channel: Channel number (channel 1, channel 36 and so on)
Length: Original length of the packet before slicing
Those values can be displayed in Wireshark columns: tzsp.wlan.signal, tzsp.wlan.rate, tzsp.wlan.channel, tzsp.original_length
In addition, there are some vendor-specific fields and other Unknown TZSP tags:
Option tag 80: Access Point name. In the example, the ASCII conversion of hexdecimal 0x617037353332 is “ap7532”
Option tag 81: Capture point on the Access Point. In the example, the ASCII conversion of hexdecimal 0x726164696f2031 is “radio 1” which is the 5GHz radio interface
Option tag 40: Sequence number used to order the packets streamed from an Access Point
Those unknown fields can be displayed in Wireshark with Custom columns that are setup in the menu Edit > Preferences > Appearance > Columns, with the field tzsp.unknown and the field occurrence (1, 2 or 3).

Similarly to the remote-debug live-pktcap command, the remote-debug offline-pktcap command allows distributed remote packet captures. However, it starts to copy the captured file only after the captures are completed.
Radio sniffer mode
The radio interface also supports Sniffer mode, which sets the radio in promiscuous mode. A radio in Sniffer mode cannot service any client traffic. However, it can capture any frames that are heard on the selected channel, including neighbouring device traffic, and continuously streams all the packets to a protocol analyser using TZSP.
Another benefit of Sniffer mode is that there is no packet limit compared to the service pktcap and remote-debug commands.
To configure Sniffer mode, use the sniffer-redirect radio interface command.
ap7532#conf t
Enter configuration commands, one per line. End with CNTL/Z.
ap7532(config)#self
ap7532(config-device-74-67-F7-D1-99-80)#interface radio 0
ap7532(config-device-74-67-F7-D1-99-80-if-radio0)#sniffer-redirect tzsp <IP> channel <CHANNEL>
You can verify that the radio is set to Sniffer mode with the following command:
ap7532#show wireless radio
----------------------------------------------------------------------------------------------
RADIO RADIO-MAC RF-MODE STATE CHANNEL POWER #CLIENT
----------------------------------------------------------------------------------------------
ap7532:R1 74-67-F7-F0-18-B0 2.4GHz-wlan Sniffer Mode N/A ( smt) 21 (smt) 0
ap7532:R2 74-67-F7-F2-50-30 5GHz-wlan Sniffer Mode N/A ( smt) 20 (smt) 0
----------------------------------------------------------------------------------------------
The next screenshot shows some packets captured on both radio with the tzsp filter on Wireshark:

Beacon frames broadcasted by neighbour APs have been captured on channel 11 and channel 149 for example. I have also noticed that all the Beacon frames in my captures were truncated at the end of the 802.11 frame body. Other packets did not have this issue.
The following picture shows an 802.11 QoS Data frame with its TZSP header:

Compared to the remote-debug capture, the radio in Sniffer mode removes some TZSP tags and adds new ones including:
Sensor MAC: this tag should normally display the Sensor MAC address, on which the packet was received. In the example, the length is more than 6 Bytes and the ASCII conversion displays some radio information (Wireless mode, Channel width, Short or Long Preamble, RSSI, Noise, Antenna, Short Guard Interval, Greenfield, Low-Density Parity-Check code, MCS index, Number of Spatial Streams, Code, A-MPDU) rather than the Sensor MAC address “vht,20MHz,longpr,s=-42,n=-92,ant=1,sgi=1,gf=0,ldpc=1,mcs=0,nss=2,code=1,ampdu=(0,0,-).”
Time: Timestamp, in µs
Frame Check Sequence: whether the packet contains an FCS error or not
Additional Resources
Extreme Wireless WiNG GTAC Knowledge Home, How to collect WiNG wireless packet capture:
Radiotap specification, GitHub:
Link-layer header types, Adrian Granados blog:
https://www.adriangranados.com/blog/link-layer-header-types
Link-Layer Header | Adrian Granados | WLPC Phoenix 2018:
https://www.youtube.com/watch?v=-L1lhqQR5Ww&feature=youtu.be
TZSP description, Wikipedia:
https://en.wikipedia.org/wiki/TZSP
Wireshark dissector for TZSP packets, Github:
https://github.com/wireshark/wireshark/blob/master/epan/dissectors/packet-tzsp.c